The Real Performance Level of Asset Classes in The Last Two Centuries
While investing is essentially a matter of common sense, it is unthinkable not to master the basics of investment grammar and some fundamentals in economics. First and foremost, it is essential to have a perfect understanding of the different asset classes, the mechanics of compound interest, the various business sectors (and their logic), and basic economic concepts (inflation, currencies, etc.).
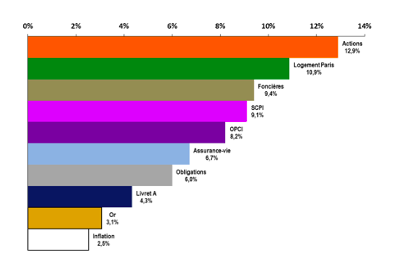
I/ Real Performance Level of Asset Classes, Their Comparative Performance: Stocks win
The first thing to do is to recall what these different financial assets are and provide an initial definition:
a) Bonds: These are “loan contracts” between you and a state or a company. You buy a financial security and, in return, you receive interest (the coupon) and a repayment of the principal at the end of the operation. A bond is therefore quite similar to a loan that you can buy and sell. Concretely, you hold bonds if you have life insurance contracts that include “euro funds” or “secured” investment vehicles.
b) Stocks: Unlike bonds, stocks are ownership titles. When you buy a share of Apple, for example, you own a fraction of the company. In return for this ownership, the value of your share of the company will fluctuate upwards (potential capital gain) or downwards (potential capital loss). You may also receive a portion of the company’s annual profits in the form of dividends. Concretely, if you buy a Sanofi share, once a year, you receive a dividend in May into your account because the company redistributes a part of its profits to you.
c) Real Estate: In this case, the exercise is simpler. You own a house, a commercial property, or offices directly (you bought them through a notary) or indirectly (by buying a share of a REIT – Real Estate Investment Trust – or a listed real estate company). Here again, you hold a title of ownership of a building and the associated land. You will receive income from renting out these properties (rents) and the value of the assets may vary. As with previous assets, your financial gain consists of, on the one hand, capital gains (the difference between the acquisition price of your asset and its resale value) and, on the other hand, rental income.
d) Gold
Key Takeaways:
- Assets can take the form of ownership titles (stocks and real estate) or contracts (bonds);
- The income from these assets can be interest (bond coupons), redistributed profits (dividends), and rents;
- All three assets can generate a capital gain – or, conversely, a capital loss.
2/ Who Wins the “Match” Over 2 Centuries?
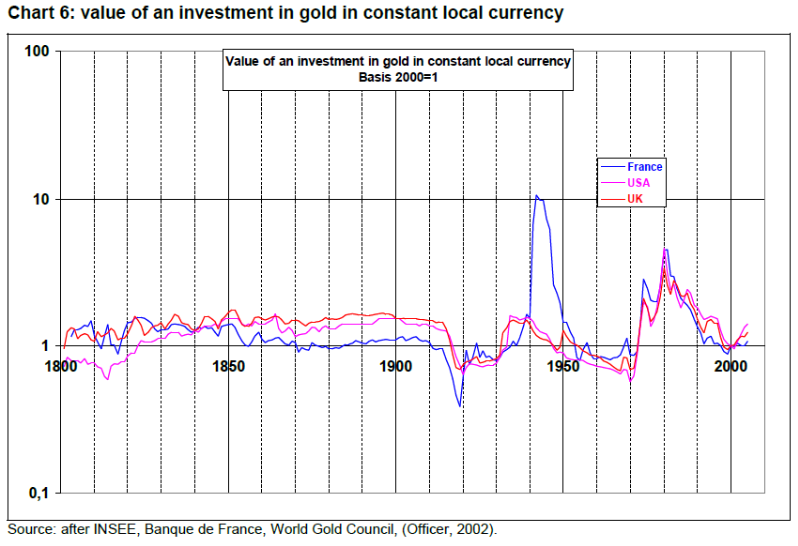
This “ranking” was developed based on an article by a French researcher¹. The subject was studied from the perspective of a French investor. Jacques Friggit studies the price evolution of different assets over the period 1800–2005. The following ranking can be established:
- 4th Place: Gold is simply a store of value: gold preserves its value over the period and thus protects against inflation. Its price can obviously vary significantly, for example during a war (look at the evolution of the blue curve during the Second World War) or an economic crisis (end of the gold standard in the 1970s). Gold is a good hedging tool against inflation.
- 3rd Place: Bonds come next with an inflation-adjusted return of 3% to 4%;
- 2nd Place: For Real Estate, the article is less assertive as it only refers to a residential real estate investment in Paris and clearly states that the timing of the purchase is decisive for the final rate of return. A deeper analysis is certainly necessary, but it emerges from various readings that stocks are the most profitable asset in the long term;
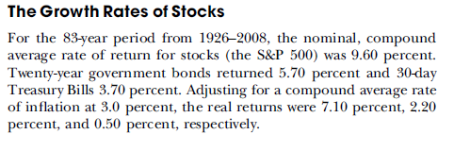
- 1st Place: U.S. Stocks offer a return of around 6.6% before inflation – or about 10% per year when reintegrating inflation. Also read the Siegel book here about historical performance.
Other authors have studied the phenomenon over shorter time periods – 86 years nonetheless, from 1926 to 2008 – and reached the same conclusion.
Dividends Still Don’t Lie: The Truth About Investing in Blue Chip Stocks and Winning in the Stock Market, Editions Wiley, page 17
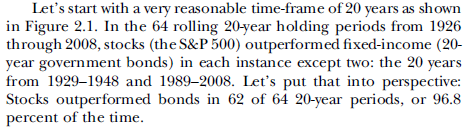
Over shorter periods of 20 years, the rule does not always apply but largely dominates (62 times out of 64 possibilities):
Dividends Still Don’t Lie: The Truth About Investing in Blue Chip Stocks and Winning in the Stock Market, Editions Wiley,, page 18
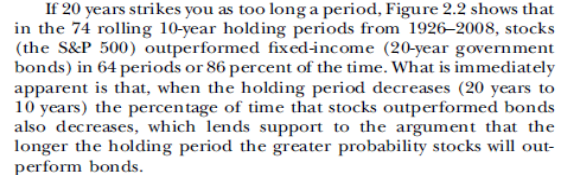
Over 10-year periods, stocks achieve better performance 64 times out of 86:
Dividends Still Don’t Lie: The Truth About Investing in Blue Chip Stocks and Winning in the Stock Market, Editions Wiley, page 20
Over a 40-year period in France, the observation is similar:
Comparison of internal rates of return over 40 years, IEIF Study 2020; 40 years of comparative performance
3/ What Lessons Can an Investor Draw from This… Who Lives Less Than Two Centuries?
First, it is necessary to recall that different assets entail different risks:
- Bonds are generally less risky, but there is a residual risk of default, whether for government bonds (e.g., Russian bonds) or corporate bonds (some high-yield bonds are very risky);
- Stocks are inherently risky because companies can go bankrupt, stop paying their dividend, or simply disappear from their market (e.g., Kodak);
- For Real Estate, an investment considered safe, the dangers are nevertheless numerous: property damage, payment issues with tenants, major incidents, etc. But the building remains, even if its liquidity is reduced.
Stocks are the most profitable but also the most volatile asset (price fluctuations are the strongest). The psychological challenge is therefore significant, as few people are able to resist when a crash occurs. Yet, it is when stock prices are low that one must hold firm and invest. In fact, the stock market is the only store where customers stop buying when the sales period begins!
4/ What to Remember from These Statistical Elements?
- Financial markets offer a range of tools that are more or less profitable and risky;
- The investments of an individual or an institution are allocated according to their objectives and risk sensitivity;
- Each asset has its function: gold for value preservation; bonds for generating income with limited risk; real estate for interesting returns but limited liquidity; and stocks for high returns in exchange for higher volatility;
- By mixing these different asset classes, you can obtain the best balance between return and security according to your profile.
2/ The Power of Compound Interest, and How to Harness It
The Method: Harnessing the Magic of Compound Interest – “The Snowball Effect”
Compound interest is the eighth wonder of the world. He who understands it, earns it … he who doesn’t … pays it.
Albert Einstein
To benefit from the advantages of finance, one must first understand them. The dynamics of compound interest constitute fundamental, simple knowledge that is, unfortunately, often overlooked. The chart below provides a clear illustration over 20 years. Imagine I invest €100 at a 10% interest rate in any given investment. Two options are available to me: spend the €10 in interest each year, or reinvest it in the same investment at the same rate. In the example below, I reinvest it methodically each year to grow my capital (and the associated investment income).
After 20 years, my initial €100 capital is worth €612: it has thus been multiplied by 6.12.
After 30 years, my initial €100 capital is worth €1,586. It has therefore been multiplied by 15.86.
After 40 years, my initial €100 capital is worth €4,114. It has therefore been multiplied by 41.14.
All of this might seem excessively optimistic. Indeed, the example is theoretical and does not account for taxation, inflation (€4,114 in the 2060s will undoubtedly buy less than it does in the 2020s), and the various uncertainties of finance. Nevertheless, it offers a glimpse into the capacity of financial markets to multiply your capital. Many also argue that a 10% rate is completely unrealistic. It was chosen not only for clarity’s sake but also because it corresponds to the economic reality of stock market returns over the long term (two centuries). Therefore, an average annual return of 10% is an achievable objective for a long-term equity investor.
Key Takeaways on Compound Interest:
- It enables exponential growth of your investment if you reinvest your earnings. This is the method to apply – all while ideally continuing to save new capital – until you reach your desired level of income.
- The Rule of 72 can help you quickly – albeit approximately – calculate your ability to double your capital or income. For a 2% return, simply divide 72 by 2, and you’ll find it takes approximately 36 years to double your capital. For a 10% rate, your capital is doubled in just over seven years (72 / 10 = 7.2 years). This provides a historical benchmark.