May 06, 2025
Are Covered Call ETFs a Scam?
The Global X S&P 500 Covered Call ETF (XYLD) lures investors with juicy monthly dividends and a promise of stability amid market turbulence. But when some folks on X call these ETFs “scams” due to capped returns or overhyped promises, should you buy into the skepticism? By selling call options on the S&P 500, XYLD generates steady income, but is it right for you? In this article, I break down the pros and cons of this strategy, compare 30 years of data between the CBOE S&P 500 BuyWrite Index (BXM) and the S&P 500, and explain why I’ve allocated a small slice of my portfolio to XYLD. Spoiler: it’s not a scam, but it’s no golden ticket to the moon either.
I. The Theoretical Features of Covered Call ETFs: More Income, Less Volatility, Less Capital Growth
A. Covered Call for Dummies
A covered call fund like XYLD buys stocks (e.g., those in the S&P 500) and sells call options on them to earn a payment called a premium. Selling a call means signing a contract that gives the buyer the right to purchase those stocks at a set price (the strike price) before a specific date (the expiration). The fund pockets the premium right away, and this cash is added to the income distributed to investors as regular dividends. If the stock stays below the strike price at expiration, the fund keeps both the stocks and the premium; if the stock exceeds the strike price, the fund must sell the stocks to the buyer at the agreed price. XYLD sells calls on the S&P 500 index.
B. Theoretical Advantages
- High Income Generation: Covered call funds deliver attractive dividend yields. XYLD, inspired by the CBOE S&P 500 BuyWrite Index (BXM), boasts an annual yield of 11.5% as of May 4, 2025.
- Lower Volatility: The premiums from selling call options cushion losses during market dips. By tracking a strategy similar to the BXM, XYLD provides diversified exposure to the S&P 500 while partially smoothing out fluctuations with the premiums collected.
- Simplicity and Accessibility: XYLD automates the covered call strategy, selling at-the-money options on the entire S&P 500. This makes the fund approachable for investors without options trading expertise, while still offering U.S. market exposure.
- Diversification Potential: By incorporating option premiums, these funds add a source of return that’s not fully tied to direct market movements, potentially improving a diversified portfolio’s risk/reward profile.
C. Theoretical Drawbacks
- The Big One: Capped Upside Potential: Selling at-the-money options limits gains during a strong S&P 500 rally. If the market surges, XYLD will lag, as the underlying stocks may be “called away” or the premiums won’t offset the missed appreciation. Newbie investors may mistakenly see the high yield as a guarantee of growth.
- High Management Fees: With an expense ratio of 0.60%, XYLD is pricier than standard S&P 500 ETFs (0.03% to 0.10%). These fees eat into net returns, especially over the long term.
- Dependence on Volatility: Option premiums are higher during periods of high volatility. In low-volatility environments (e.g., a low VIX in 2023), XYLD’s yields can shrink as premiums become less lucrative.
- Tax Complexity: Monthly distributions may include dividends, capital gains, and return of capital, complicating tax management, especially for investors in high-tax regions.
Some investors label covered call ETFs like XYLD as “scams” due to misaligned expectations and sometimes misleading marketing. The high yields, like XYLD’s 11.5% annual dividends, attract those hoping for both steady income and S&P 500-like growth. Yet, the strategy caps gains in bull markets, leading to significant underperformance (e.g., 6.72% vs. 13.17% for the S&P 500 from 2016 to 2023), frustrating poorly informed investors. Plus, high fees (0.60%) and tax complexity, often downplayed, fuel the “scam” perception, especially when promises of “protection” against downturns fall short, as seen in the 2018 drawdowns. Let’s dig into the reality.
II. In Reality
A. Over the Long Term, the BXM Underperforms the S&P 500, Delivers Income but Offers Limited Volatility Protection
Analyzing historical data for the CBOE S&P 500 BuyWrite Index (BXM) from 1986 to 2018, the benchmark inspiring XYLD’s strategy, shows that the core promises of covered calls hold true:
- Lower Volatility: Annualized standard deviation of 10.6% for BXM vs. 14.9% for the S&P 500.
- Smaller Maximum Drawdown: -35.8% for BXM vs. -50.9% for the S&P 500.
- Respectable but Lower Performance: 8.5% for BXM vs. 9.8% for the S&P 500. This performance supports an attractive yield but is theoretically capped at 8.5% annually over the long term.
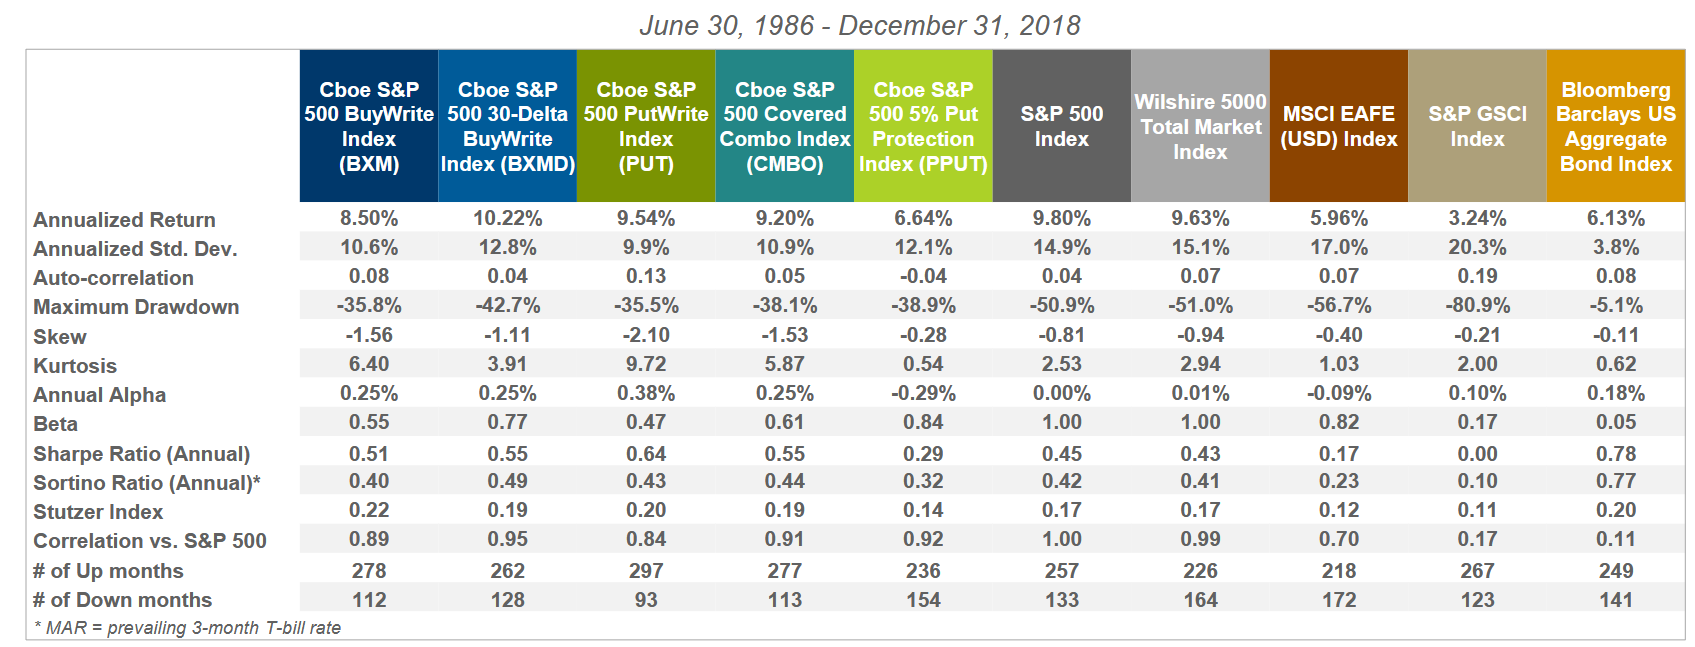
The BXM delivers on its promises, offering lower returns in exchange for steady income and reduced volatility. In theory, it’s a solid choice for income-focused investors. But an index is a theoretical construct, free of operating fees and taxes. Let’s now examine the performance of the ETF tracking a similar strategy to see if reality matches the theory.
B. Since Its Inception in 2016, XYLD Has Delivered Lower Total Returns, Less Volatility, but Notable Drawdowns
Since its launch:
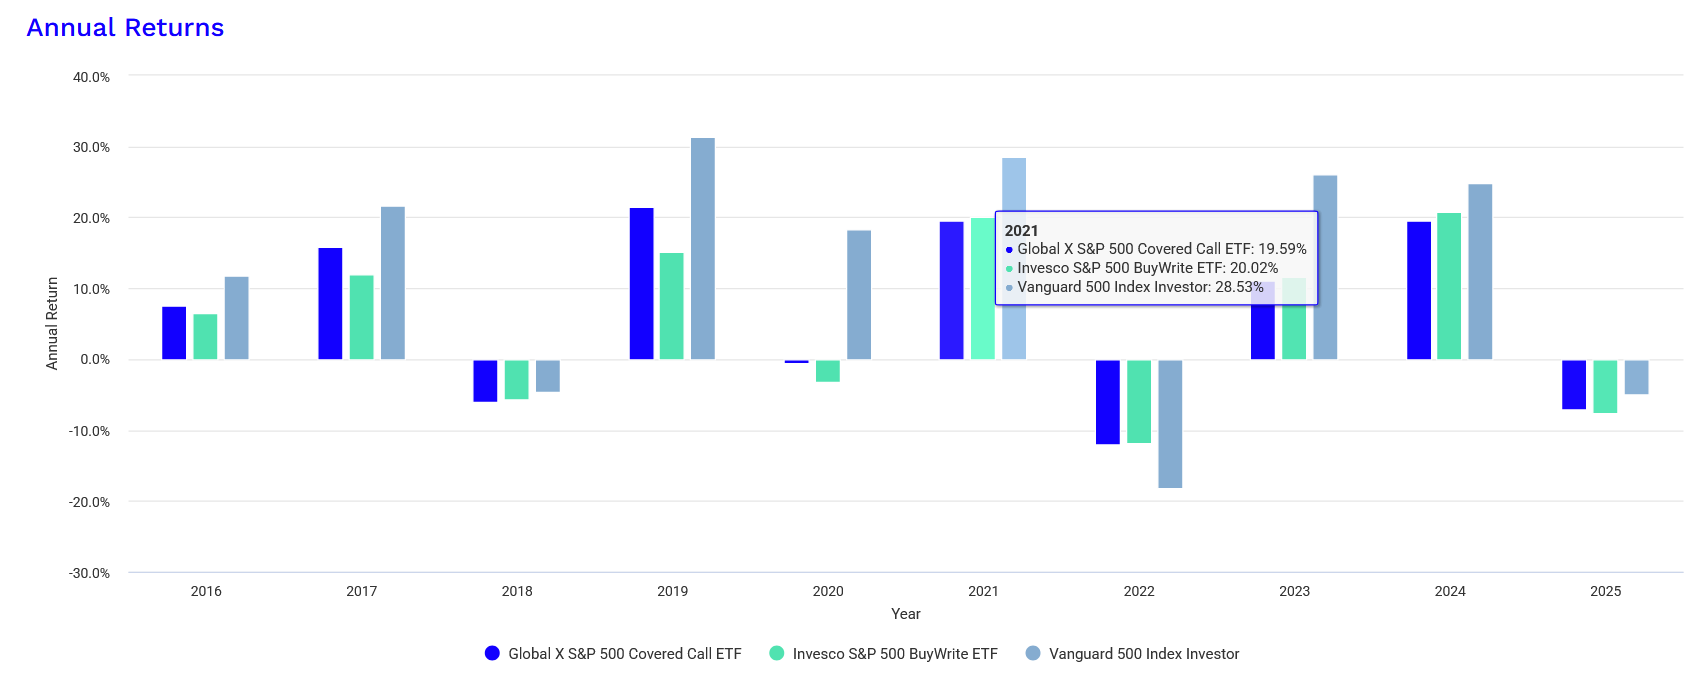
- Total Return: XYLD achieved 6.72% vs. 13.17% for the S&P 500. Note that these figures cover a specific period (2016-2023) that includes a bull market, which biases the results.
- Standard Deviation: XYLD at 11.94% vs. 15.47% for the S&P 500.
- Maximum Drawdown: XYLD at -23.44% vs. -23.95% for the S&P 500.

Here’s a comparative chart of XYLD, IVVW (iShares S&P 500 BuyWrite ETF)—a competing ETF with a similar but less aggressive strategy and lower fees (0.30%)—and the S&P 500, with dividends reinvested, since 2016:
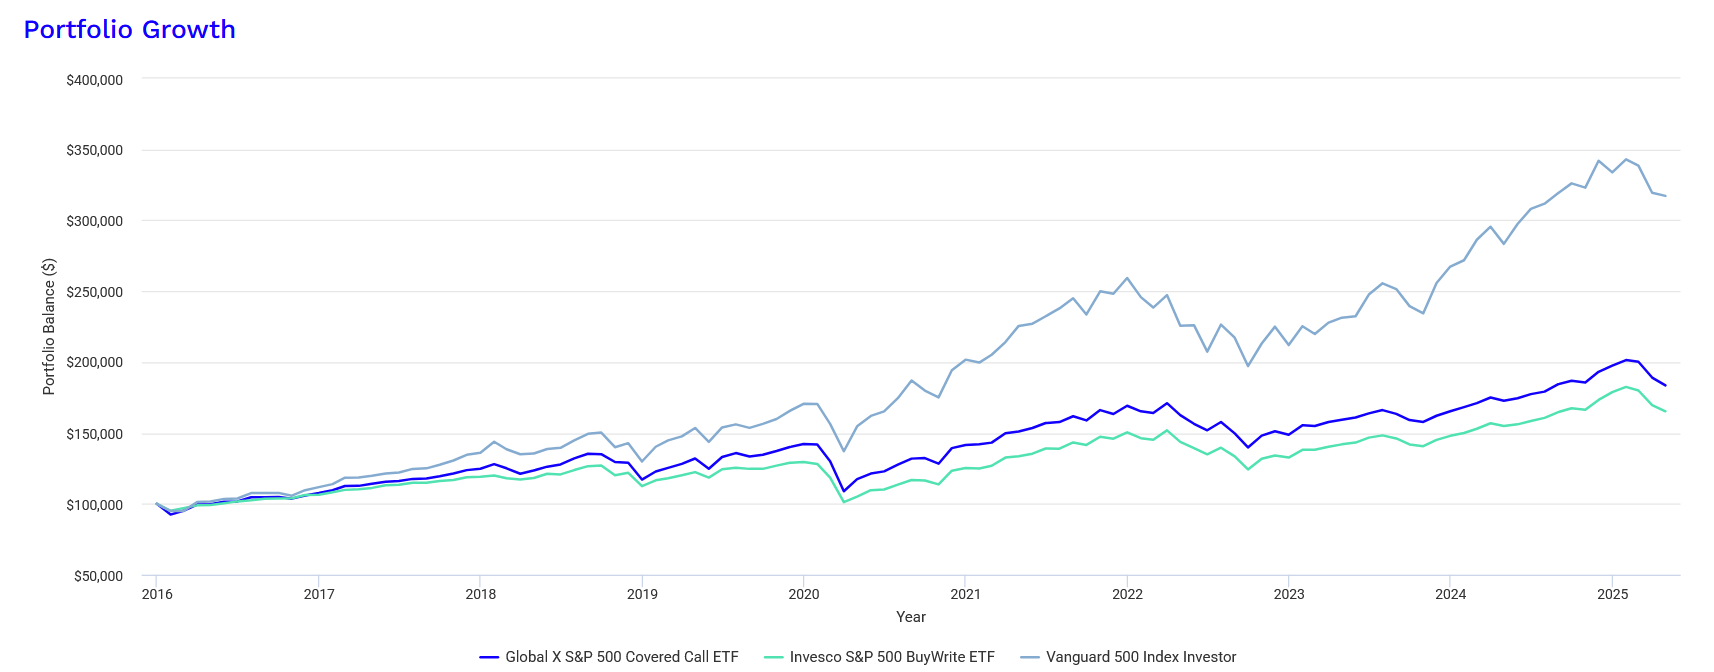
The returns generally align with theoretical principles: smaller gains and smaller losses. However, in 2018 and 2025, XYLD’s drawdowns were paradoxically larger than the S&P 500’s in some instances. This may seem minor, but it matters for investors using leverage on these ETFs, expecting covered calls to shield them from steep declines—it doesn’t always work.
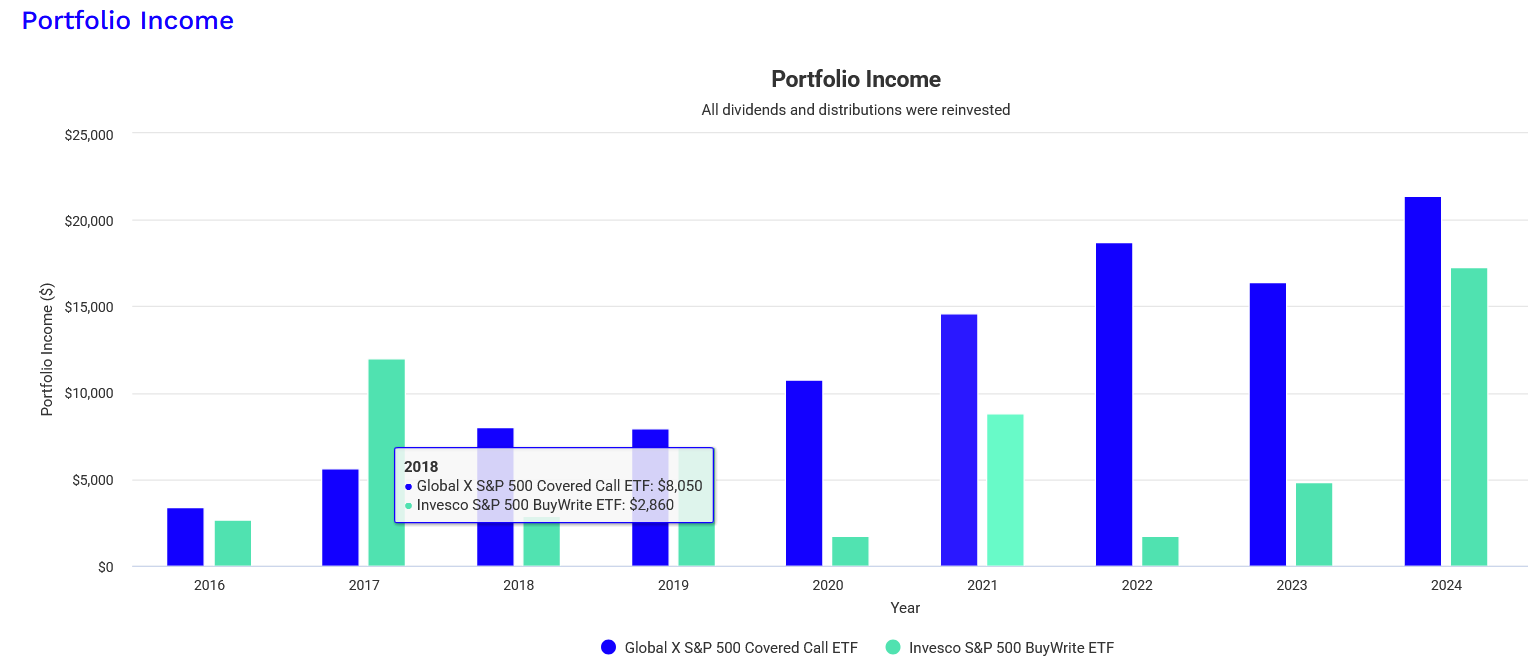
IVVW, XYLD’s competitor, offers more variable and lower income. However, it better preserves initial capital. When dividends aren’t reinvested, XYLD’s value drops by 12.41%, from $100,000 to $87,594, while IVVW’s rises by 5.28%.
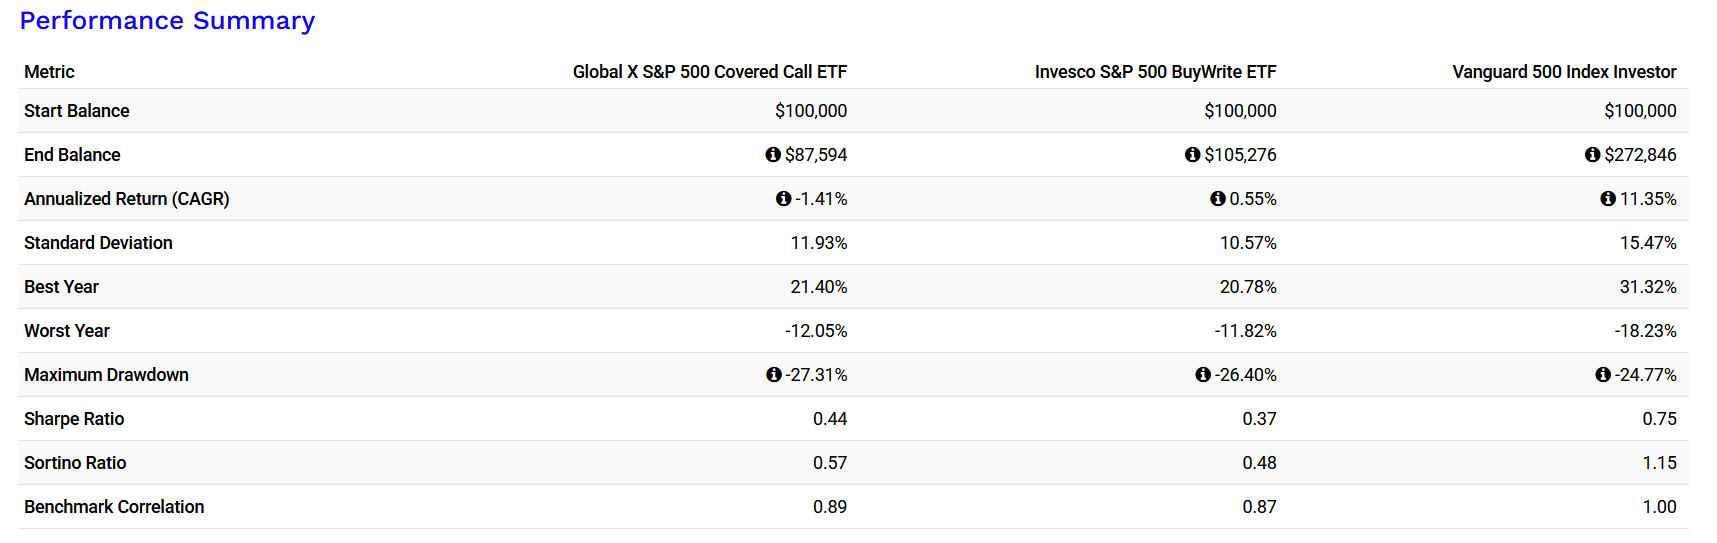
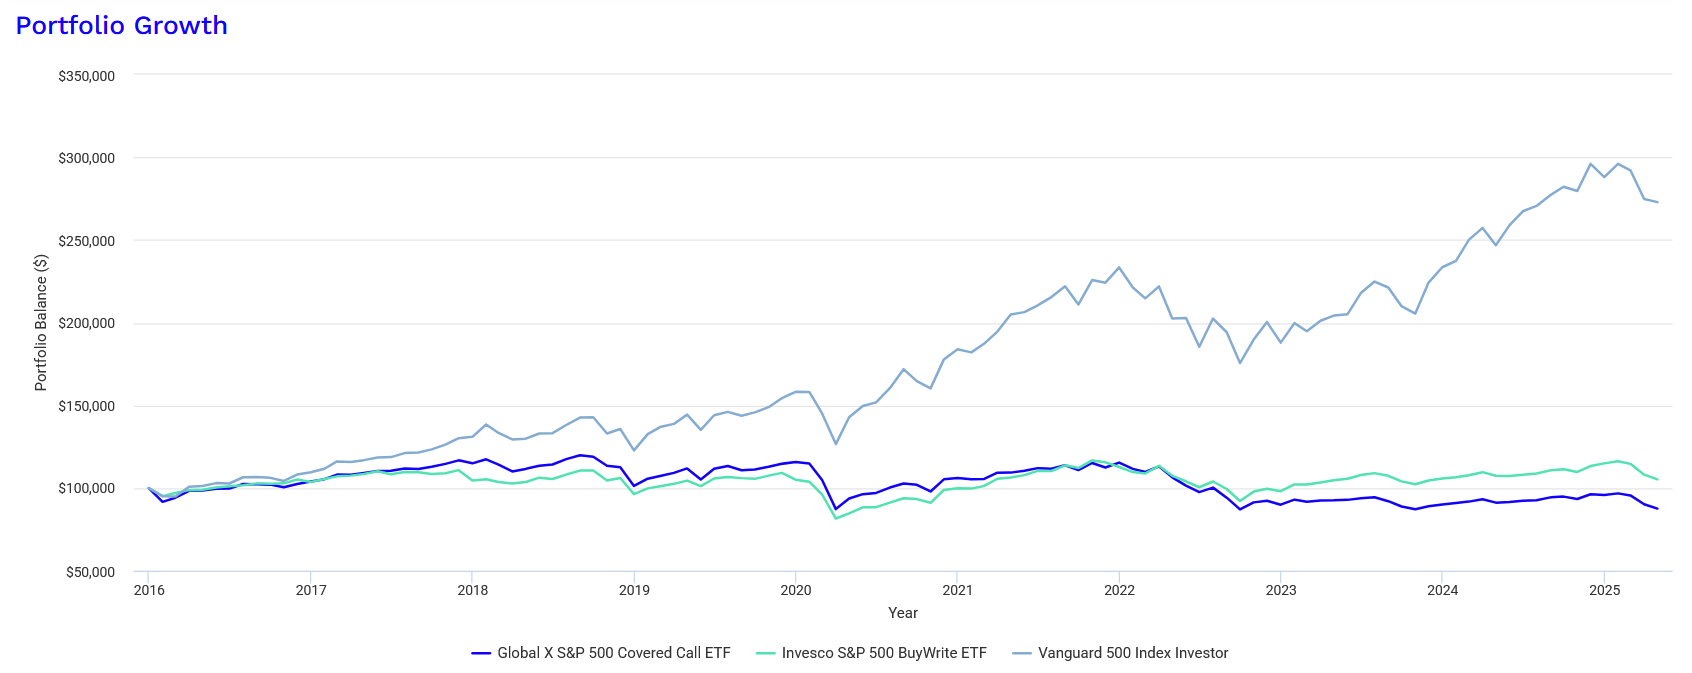
Over the studied period, XYLD significantly underperformed the S&P 500. This should be tempered, as a strong bull market since 2020 aligns with the strategy’s theoretical limitations.
My Investment Takes
XYLD meets its broad goals, but the results can feel underwhelming:
- The underperformance compared to the S&P 500 is significant, and downside protection is relatively weak. Evidently, high distributions sometimes include return of capital, reducing XYLD’s net asset value (NAV) by 12.41% since 2016.
- The ETF pays out too much of its income, leading to a decline in its NAV price.
- XYLD isn’t a scam, but it’s only suitable for income-focused investors who fully understand the strategy’s benefits, limitations, and the impact of its fees.
- As an income investor, I’ve added a small position to monitor its behavior and because I don’t expect a strongly bullish market in the coming years. What about you—are you ready to trade growth for steady dividends?
Liked this Deep-Dive? Buy Me a Coffee!
Your support keeps this newsletter independent and research-driven. If this analysis saved you time or gave you a new investment idea, consider making a one-time donation. Every contribution helps me maintain part of the research free and accessible to everyone. Covered calls ETFs a scam? No.