Jan 03, 2026
My ambition in January 2025 was straightforward: after more than a decade of observing and investing in the stock market, I wanted to lay the foundations for a true global income portfolio – multi-currency, covering all geographical regions, and targeting an income stream in the region of 10 %. Everyone understands the trade-off here: accepting slightly lower total returns in exchange for a high, reliable income.
This portfolio is built with my own personal capital, using the same ideas and holdings I share transparently with my subscribers. In practice, I began allocating capital at the start of 2025, though I staggered some investments until March and April to take advantage of better entry points. This makes precise time-weighted tracking a bit trickier, but for this first-year review, it feels more honest and useful to consider the full calendar year 2025. I also started publishing regular updates on Substack in March 2025.So, it’s time for the annual review. Let’s dive into the details with clear-eyed honesty.
I/ The Portfolio’s “Big Picture” Data: A Strong First Year Overall
A/ Solid Total Return, Just Shy of the S&P 500
While the portfolio’s total return was lower than that of the MSCI World, it significantly outperformed a major high-yield bond index. This outcome aligns perfectly with the portfolio’s core objective: to generate high, reliable income while maintaining competitive performance.
Disclaimer on Granular Detail: For readers seeking exhaustive detail on the portfolio’s composition, the figures presented here are approximations. A complete, line-by-line audit with full transparency—including the rationale behind each monthly trade—will be published for paid subscribers in April 2026. Free subscribers retain full access to all aggregated performance data and strategic commentary. Another tradeoff.
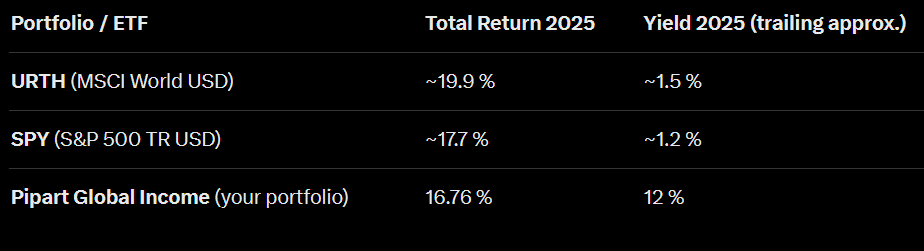
But investing is a matter of facts. So let’s begin and we can now say that my portfolio has lagged both MSCI World USD and SP500 on a total return basis — with 16.76% for Pipart Global Income versus approximately 19.9% for URTH (tracking MSCI World) and 17.7% for SPY (tracking the S&P 500) over the full year 2025.This slight underperformance (around 1 percentage point behind the S&P 500 and 3 points behind the broader developed markets) is entirely consistent with the deliberate trade-off I accepted from the outset: prioritizing a massive yield of 12% — roughly 10 times higher than the ~1.2-1.5% delivered by these equity benchmarks — in exchange for potentially lower capital appreciation during strong bull markets dominated by low- or no-yield growth stocks.
In a year like 2025, where U.S. tech and growth names drove much of the upside, this gap was expected and even relatively contained. The real measure of success for a global income strategy lies not in beating pure equity indices every single year, but in delivering substantial, reliable cash flow while still capturing meaningful participation in market gains — which, at nearly 17%, it undeniably did. However, honesty compels me to admit that, irrationally, it does sting a bit.
This is the psychological cost of the chosen trade-off—a small bruise on the ego in exchange for a massive deposit into the bank account.
The lesson is clear: in its first year, my global income portfolio has indeed lagged the total return of the main global equity indices — just as theory predicted. But the underperformance has been slight, and I’m genuinely pleased with that outcome.
B/ The Core Achievement: Massive & Reliable Income
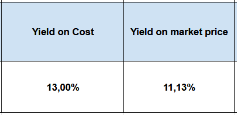
So much for total return. Now, let’s talk about the real return—the cold, hard cash hitting the account. Because the excellent news lies elsewhere: the yield is holding above 10%. I benefited from fortunate entry points, which matters enormously, and we will see in the coming years if it remains possible to find good entries. In short, I have secured a high yield, and from now on we will focus on just two indicators: yield on market price and yield on cost.
As of January 1st, 2026, the results were as follows: a seemingly enormous yield on cost of 13% and a yield on market price of 11.13%. The yield on cost is set to systematically surge upwards because I reinvest all dividends until retirement. These dividends generate new dividends, allowing the figure to progress constantly—barring significant dividend cuts. As for the yield on market price, it has decreased because the price of many income-generating assets rose during the year. This is an almost ideal scenario. We won’t complain, but we will remain prudent. In any case, the income is there—massive income—and distributed fairly regularly.
II/ The I-CASH Analysis: Diversification, The Main Area for Improvement
Let’s maintain the analytical framework of Pipart Global Income for portfolio evaluation—the I-CASH methodology.
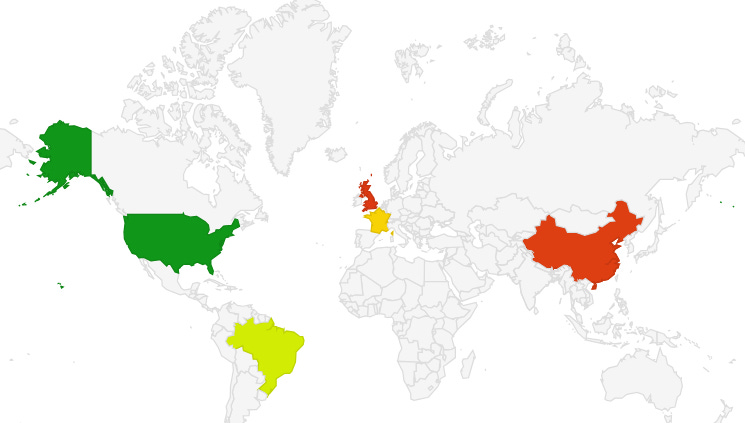
I for International.
My portfolio is designed with a global focus, though it isn’t yet fully global. Take a look at the map below. I’ve invested in only 5 countries so far, which remains limited—even if the companies in question have significant market shares beyond their home borders. Enhancing this will be one of my key priorities in the coming years. That said, I have still managed to steer clear of the home bias that plagues the vast majority of individual investor portfolios. I intend to increase geographic diversification further using the income I collect
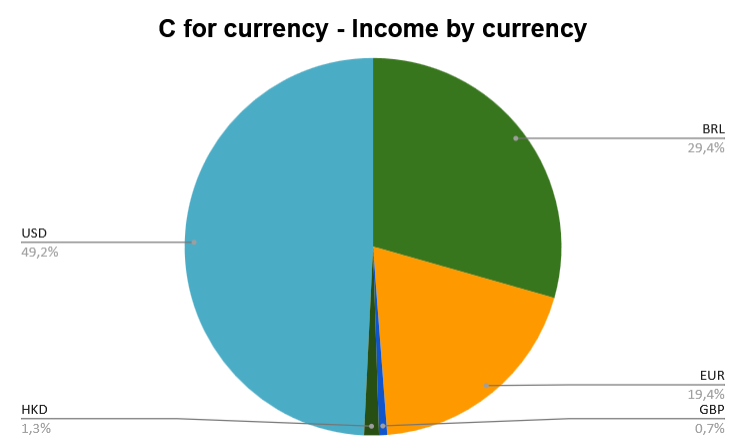
C for Currency
I remain overly dependent on the USD—though this level of dependence still seems entirely acceptable to me at this stage. Let’s take a closer look. The largest portion, nearly half of the total income at 49.2%, is denominated in USD (US dollars), shown in light blue. This indicates a strong dominance of the US dollar in the income breakdown. The second-largest share belongs to BRL (Brazilian real) at 29.4%, represented by the green segment, suggesting significant exposure to the Brazilian market or economy. EUR (euros) accounts for 19.4% in orange, reflecting a notable but smaller contribution from the Eurozone. The remaining currencies are minor: GBP (British pound) at just 0.7% and HKD (Hong Kong dollar) at 1.3%, appearing as thin slices in dark green and blue, respectively. Overall, the chart highlights a heavy reliance on USD, followed by BRL and EUR, with very limited income from other currencies.
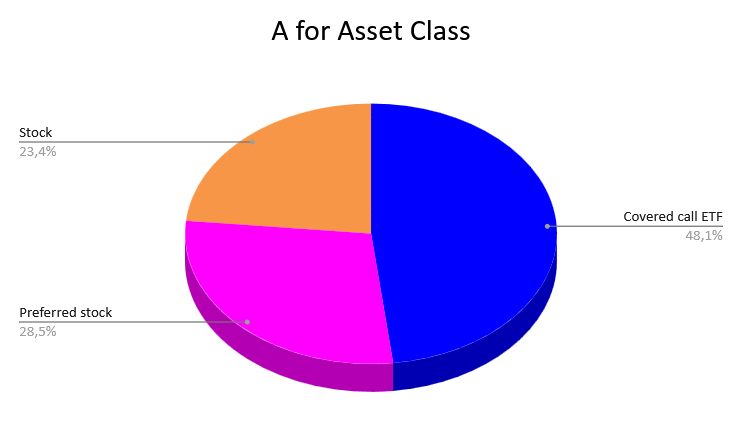
A for Asset Class
On this front, I am still far too dependent on covered call ETFs, which account for nearly half of the portfolio’s income. This is only temporary, but it signals a lack of resilience in the portfolio and a reliance on market volatility. While this is normal at this stage, it should not persist over the long term. The largest segment is Covered call ETF at 48.1%, represented in blue. This indicates that nearly half of the assets are held in exchange-traded funds employing a covered call strategy—typically used to generate income while holding underlying stocks, with a focus on enhanced yield and moderate growth. Preferred stock accounts for 28.5%, shown in pink. This reflects a significant allocation to preferred shares, which generally offer higher dividend yields and priority over common stocks but have limited capital appreciation potential. Common Stock makes up the remaining 23.4%, in orange, providing exposure to traditional equity ownership with potential for growth.
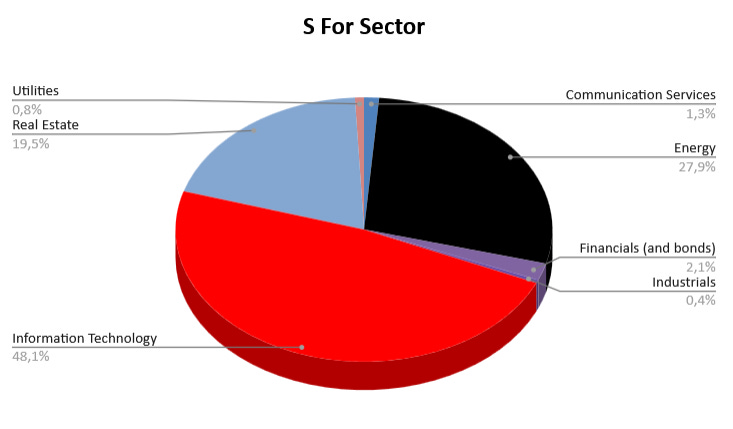
S for Sector
The dependence on the tech sector is staggering when you look at the chart—it accounts for 48.1% of income. Reducing this exposure through the reinvestment of portfolio dividends will be the top priority in 2026.
We now have the plan for 2026 and the coming years: diversification, diversification, diversification—without ever sacrificing H for High Yield (I now set a minimum yield requirement of 8% for any new investment, which also allows me to incorporate high-quality international assets). The I-CASH method is proving to be an effective tool for both analysis and reinvestment strategy.
III/ A Quick Look at Holdings & An Administrative Update
I’ll move through this part more quickly, as the detailed analysis will come later. That said, in terms of total return, it’s worth noting that several portfolio holdings outperformed the portfolio itself, notably JEPQ and Legal & General. Others performed in line with the portfolio average: Icade, XYLD. Some were a bit below, like Petrobras (PBR.A), while others detracted from portfolio value, such as Edvantage. Finally, other investments are too recent to form a meaningful opinion on, like PFF, Banco do Brasil, and JEPG.
Regardless, I don’t regret any of these investments. And I’ve already opened new positions in January 2026. Most importantly, this stands: I like my holdings and view them all as long-term investments, despite the risks inherent to some of them. Taken as a whole, they complement each other well. The main task now is to balance the sizing of each position.
The only tax update I’m aware of at the beginning of January 2026 is the change to dividend taxation for non-resident holders of Brazilian shares: the withholding tax rate is now 10%. This is relatively bad news for the Pipart Global Income portfolio given its exposure to Brazil, but the impact is limited—and it comes with the territory when investing globally.
Investor Takeaway: A Lucky First Year & Results in Line with Expectations
Few questions remain, really. Did this portfolio succeed in converting market growth into income? Yes.
Did I sacrifice some market performance by making this trade-off? Yes, but in the end, the sacrifice was relatively minor for this year.
Does this portfolio bring me a sense of security for my future financial freedom? Yes, but not yet enough—it still lacks sufficient geographic, sector, and currency diversification.
What are the prospects for 2026? Beyond diversification, I will seriously consider using leverage to sharply accelerate the growth of my yield on cost. It could have been worse—the method is delivering early results. I remain cautious; we’ll truly know whether the strategy is a success in ten years’ time.
Morale of the story: a global income portfolio is not designed to win bull markets — it is designed to pay you regardless of them.
In 2026, I’ll publish more granular allocation and position-sizing decisions for paid subscribers, while keeping all high-level performance data fully public.
Liked this Deep-Dive? Buy Me a Coffee!
Your support keeps this newsletter independent and research-driven. If this analysis saved you time or gave you a new investment idea, consider making a one-time donation. Every contribution helps me maintain part of the research free and accessible to everyone.