My I-CASH Method for Global High Income
Jun 24, 2025
Are you tired of seeing your investment portfolio buffeted by geopolitical storms or unpredictable currency swings? In Part 1, we dissected the inherent dangers of an undiversified portfolio, revealing how even seemingly safe havens can crumble under global pressures. The path to resilience is clear: global diversification. But how do you actually put it into practice?
In Part 2, we dive into the actionable steps of the I-CASH method—my proven framework for constructing a robust, income-generating portfolio. This strategy guides you through International Diversification (I), targeting varied markets; Currency Diversification (C), focusing on undervalued currencies; Asset Class (A), choosing optimal income-generating assets; Sector Diversification (S), spreading across industries; and finally, High Yield (H), prioritizing strong returns. Let’s unlock the secrets to building a truly resilient income portfolio.
I. The I-CASH Method: Your Blueprint for Consistent Income
No investment approach is flawless, but a clear framework is your most potent defense against market noise and impulsive decisions. It guards against chasing fleeting trends and helps you stay level-headed during sudden market swings. The I-CASH method, which I’ve refined over years, offers a consistent, structured way to reinvest dividends each month, systematically deciding which market, currency, asset, sector, and yield level to target.
The acronym I-CASH isn’t just a mnemonic; each letter represents a crucial reinvestment principle designed to manage portfolio concentration and maximize income:
- I (International Diversification): Directs where we allocate capital across countries.
- C (Currency Diversification): Emphasizes selecting currencies that offer an edge.
- A (Asset Class): Focuses exclusively on income-generating assets. Our choices span stocks, preferred shares, bonds, listed real estate (REITs), and crucially, covered call ETFs, which we treat as a distinct asset class for their specific income profile.
- S (Sector Diversification): Follows the widely recognized 11 GICS (Global Industry Classification Standard) sectors. Sectors with naturally higher dividend payouts will, of course, receive a greater weighting in our income-driven approach.
- H (High Yield): This is our gatekeeper. Yields below a strict 9-10% threshold simply don’t qualify for consideration.
II. I for International Diversification: Spreading Your Wings
A. Principles and Tools
Our core objective here is to spread portfolio investments across all continents and various markets. The most direct and often most effective way to achieve this for high income is by investing in local stock exchanges, actively seeking out stocks with significant income potential.
Some might argue that simply buying an MSCI World ETF is less effort. True, it offers broad diversification with minimal fuss. However, our aim isn’t just broad exposure; it’s high income. Direct investment allows us to pinpoint undervalued, high-yielding opportunities that broad ETFs might dilute or overlook entirely.
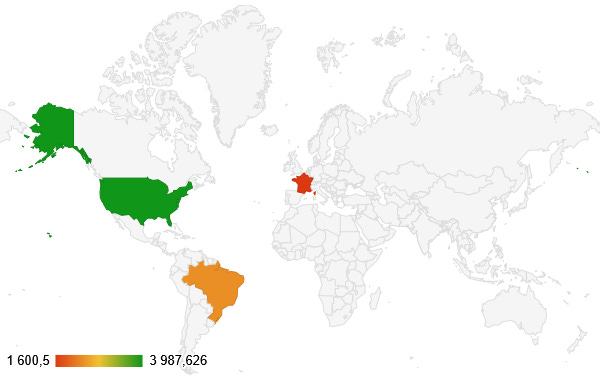
The tool for this step is straightforward: a world map that visually plots your portfolio’s investments. This immediate visual feedback clearly shows where you’re overexposed and where untapped opportunities lie.
B. Case Study: My Portfolio’s Global Footprint
Let’s apply this to my personal portfolio, currently valued at just under $80,000 and generating over $9,000 annually. I’ve completely rebuilt it between February and early June 2025. With $400 in fresh dividends ready for reinvestment, it’s time to put the I-CASH method into action.
A quick glance at my world map reveals a significant cluster in the U.S., Brazil, and France. This immediately flags a clear priority: diversification into regions like Asia or other parts of Europe is essential to de-risk and unlock new income streams. The analysis, at this point, couldn’t be simpler.
I also find a global map of price-to-earnings (PE) ratios invaluable for perspective; let’s review the current landscape:
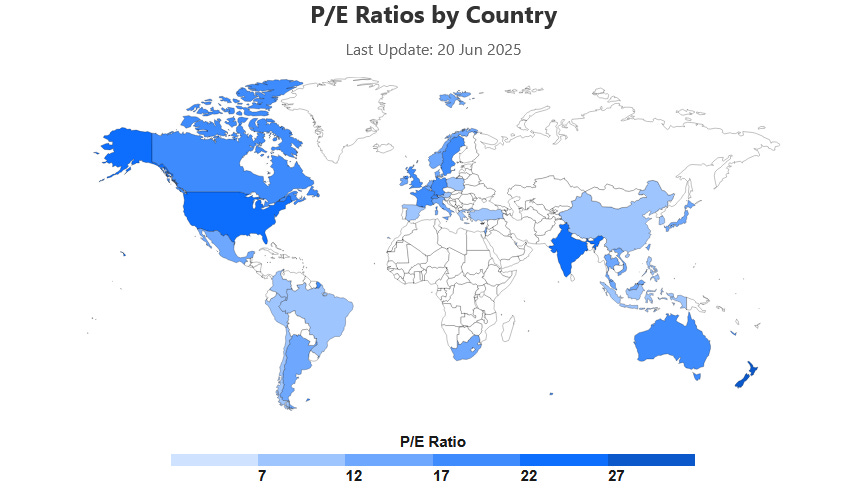
Source: https://worldperatio.com/
III. C for Currency Diversification: Beyond the Dollar
A. Principles and Tools
The concept here is unambiguous. In a global landscape marked by currency conflicts, trade disputes, and the gradual erosion of the dollar’s unchallenged dominance, deliberately choosing undervalued currencies adds an additional layer of value. This can act as an extra source of alpha, potentially boosting your effective yield or offering capital appreciation as the currency normalizes.
For now, a basic chart comparing current exchange rates to their 20-year averages provides sufficient insight. As the portfolio expands to include more currencies, a more advanced tool—perhaps employing a Z-score (a statistical measure of deviation from the average) for each reinvestment—will become necessary to pinpoint significant deviations. For today’s USD dividend reinvestment, let’s take a practical look at what the charts reveal.
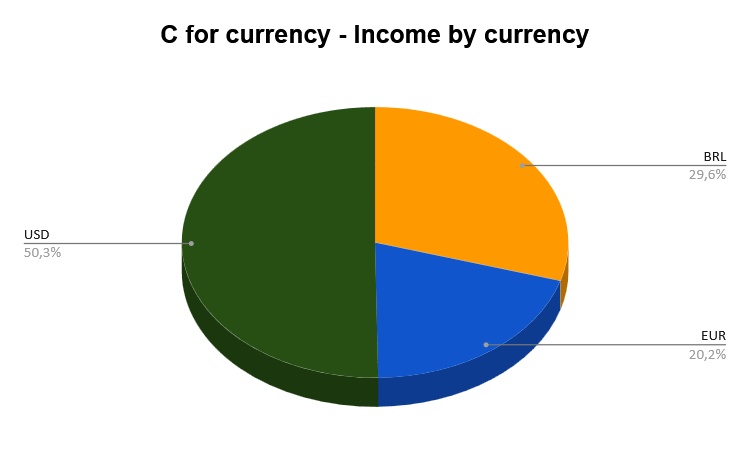
B. Case Study: My Currency Mix
As the chart below illustrates, my portfolio is overwhelmingly USD-based, with only three currencies represented.
Since we’re reinvesting USD dividends, let’s examine the USD index (DXY), which tracks the dollar’s value against a basket of major currencies: Euro (57.6%), Japanese Yen (13.6%), Pound Sterling (11.9%), Canadian Dollar (9.1%), Swedish Krona (4.2%), and Swiss Franc (3.6%).

The dollar currently hovers around its historical average, suggesting a neutral stance. However, it’s slightly weaker against the Euro (around 0.90, above its 20-year average of ~0.80), so we’ll steer clear of Euro-denominated assets for now. Conversely, it’s notably strong against the Japanese Yen (JPY). The challenge, though, is that few Japanese stocks offer dividend yields near our 10% threshold.
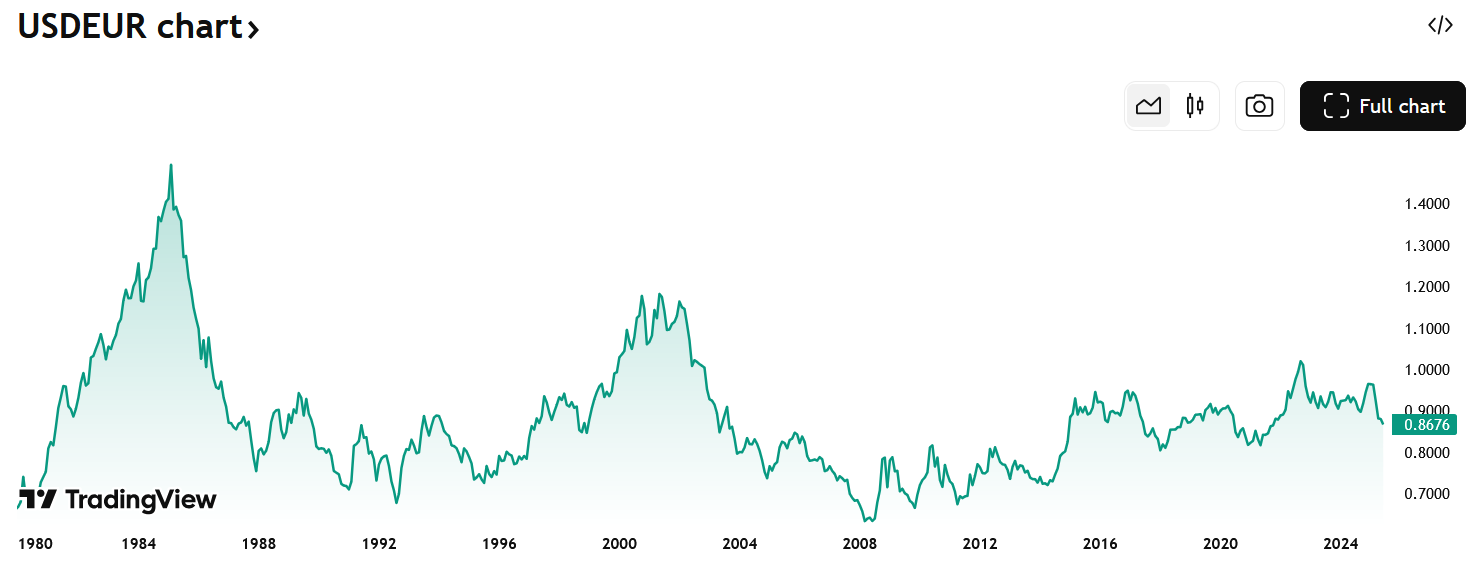
Source: https://www.tradingview.com/symbols/USDEUR/?timeframe=ALL
To streamline the process, a simpler, cross-currency comparison tool showing current rates versus 20-year averages confirms two standout undervalued currencies: the Japanese Yen (JPY) and the Brazilian Real (BRL). This immediately narrows our focus.
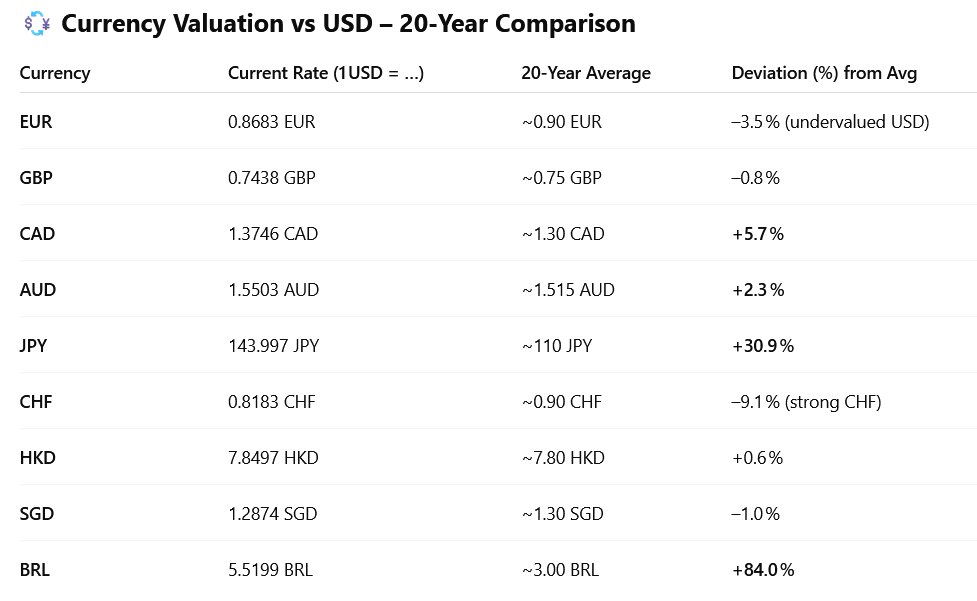
=> At this point, Japan and Brazil emerge as top targets. My portfolio already holds BRL assets, but none in JPY.
IV. A for Asset Class: Optimizing for Income
A. Principles and Tools
The core idea here is straightforward: diversify across income-generating asset classes to strengthen the portfolio’s income resilience. While traditional diversification often aims to safeguard portfolio value during market declines (a goal I approach with skepticism for this specific strategy), our singular focus here is generating maximum, sustainable income.
The tool is simple, both during initial portfolio construction and ongoing accumulation phases: allocate cautiously across various income assets (stocks, preferred shares, bonds, REITs, covered call ETFs). We maintain a strong preference for high-dividend stocks, adjusting allocations to correct any imbalances that arise.
B. Case Study: My Income Mix
The analysis for my current portfolio is fairly clear: stocks account for only 20.4% of the portfolio’s income, while covered call ETFs are overrepresented at 50.3%. Without setting a rigid target at this stage, the immediate priority is to rebalance by adding more stocks before making further granular decisions.

=> A high-yield Brazilian or Japanese stock would significantly help rebalance the portfolio toward more direct equity exposure while simultaneously boosting overall income.
V. S for Sector Diversification: Broadening Your Income Streams
A. Principles and Tools
The goal here is to invest across all 11 GICS sectors. We place a strong emphasis on naturally dividend-heavy sectors like utilities (known for stable cash flows), financials (often mature businesses), real estate (via REITs, which are legally mandated to distribute most earnings), and communication services (established revenue streams). ETFs employing covered call strategies also play a role where they support our income objectives.
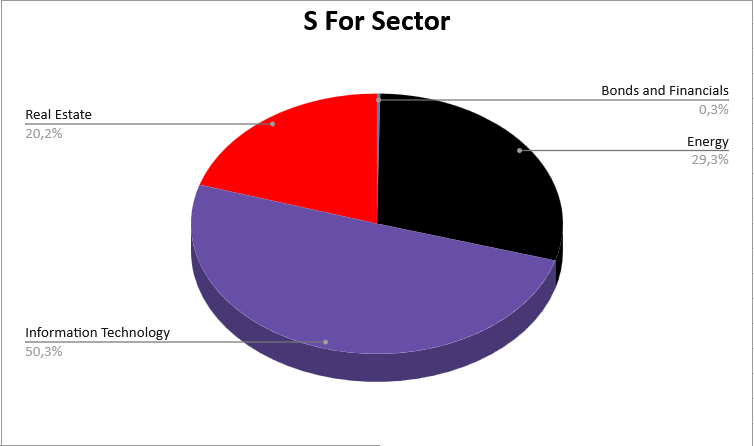
The tool remains basic but effective: a visual chart that quickly highlights sector imbalances. As shown below, three sectors currently dominate my portfolio—energy, information technology, and real estate—clearly indicating a need for broader diversification.
(Insert Image: Your Portfolio’s Sector Allocation Chart) Caption: My portfolio’s sector allocation, illustrating concentrations in Energy, Information Technology, and Real Estate.
B. Case Study: Expanding Beyond the Big Three
My portfolio must expand beyond its initial three dominant sectors. Any of the remaining eight GICS sectors would contribute to greater balance and income stability.
=> A high-yield Brazilian or Japanese stock in a sector outside Energy, Real Estate, and Information Technology would be ideal to both rebalance the portfolio and increase its income-generating capacity.
VI. H for High Yield: The Income Threshold
A. Principles and Tools
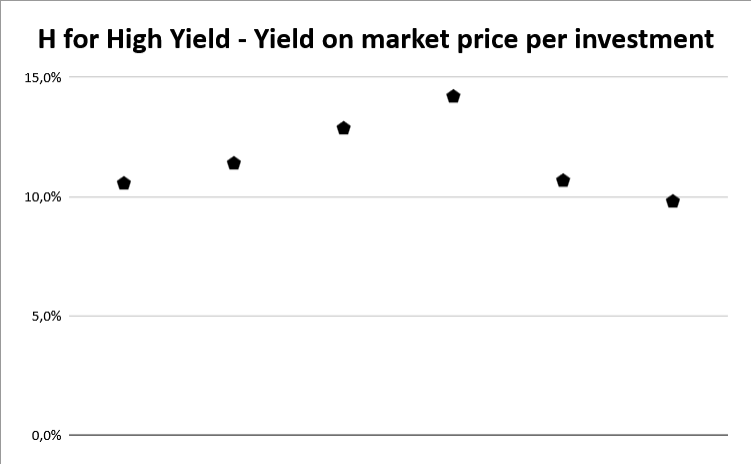
This criterion is central and highly selective in my investment strategy: yields below a strict 9-10% threshold simply don’t make the cut. I maintain a focused watchlist of potential stocks and covered call ETFs, allowing for close tracking and quick decision-making.
The primary tool is visual—a scatter plot that quickly highlights promising opportunities where yield meets our demanding criteria relative to market price. It’s crucial to note that in a high-yield portfolio, these levels can shift rapidly, particularly for “accidental high yielders” – companies whose stock price has fallen, artificially inflating their yield, which can sometimes signal underlying distress rather than sustainable income. Our analysis aims to distinguish between the two.
B. Case Study: Finding Our High-Yield Target
This article is already quite detailed, and we’ll delve deeper into the nuances of yield analysis in a future piece. However, my current watchlist includes no Japanese investments with a thoroughly studied and sustainable yield above 10%. In Brazil, fortunately, I’ve identified a stock in the Financials sector that comfortably exceeds our 10% dividend yield requirement. I believe this is our prime candidate for these dividends.
=> My watchlist pointed directly to Banco do Brasil (ADR), a Brazilian stock in the Financials sector. This selection not only offers a high dividend yield (>10%) but also provides diversification outside my current dominant sectors of Energy, Real Estate, and Information Technology, while addressing my currency and international diversification goals.
Conclusion: The Power of I-CASH
The experimental I-CASH method, inspired by the principles of robust income generation, offers a simple, rational framework for strategically reinvesting dividends. As demonstrated in our USD dividend reinvestment case study, by systematically balancing International Diversification (I), Currency Diversification (C), Asset Class (A), Sector Diversification (S), and High Yield (H), it allows us to identify compelling high-yield opportunities while actively managing portfolio concentration.
Our analysis, despite initially pointing to the undervalued Japanese Yen (JPY), ultimately shifted focus to Brazil’s Real (BRL) due to a lack of suitable high-yield options in Japan. This led us directly to Banco do Brasil (ADR), a financial stock yielding over 10%. This choice provides crucial diversification while relentlessly prioritizing income.
We’ll track the performance of the I-CASH method in the coming months, sharing regular updates to assess its effectiveness in delivering resilient, high-yield results.
Don’t miss the next steps in building this powerful income portfolio. Subscribe to follow the journey and see the results!
Liked this Deep-Dive? Buy Me a Coffee!
Your support keeps this newsletter independent and research-driven. If this analysis saved you time or gave you a new investment idea, consider making a one-time donation. Every contribution helps me maintain part of the research free and accessible to everyone.